
Punta Cana Investment Zones
DATA-DRIVEN ZONE INTELLIGENCE
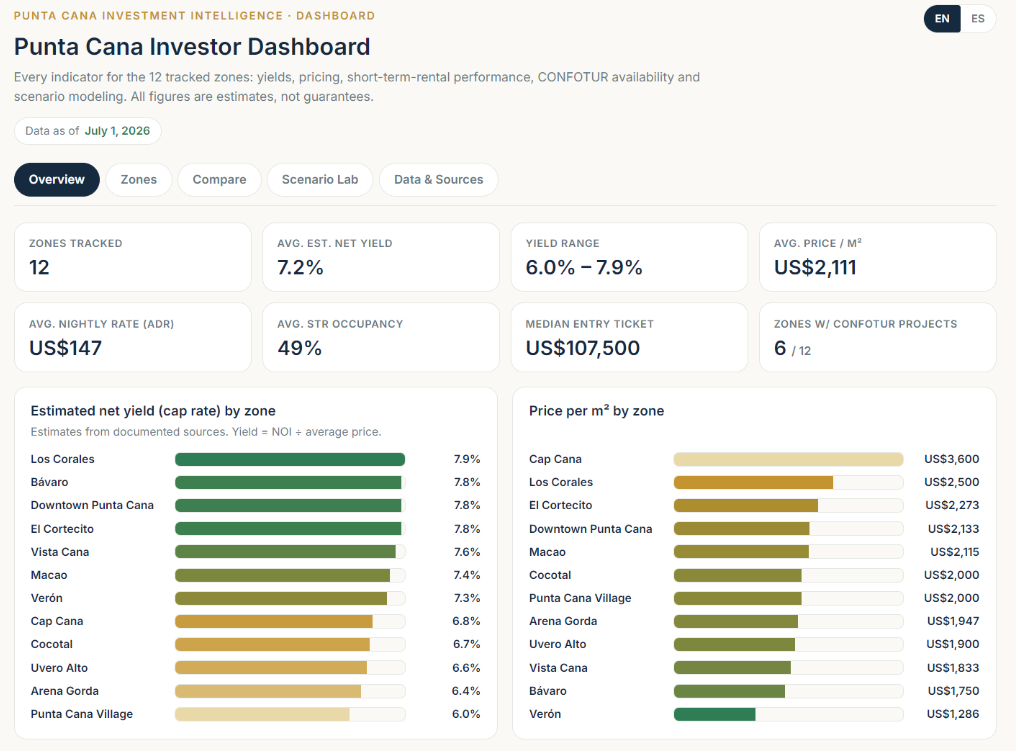
Twelve tracked zones. Estimated net yields, price per m², short-term-rental performance, and CONFOTUR availability — built from documented sources, not sales brochures. Explore the map, compare zones, and see where the numbers actually point before you commit capital.
Start with the map — then use the dashboard below to compare zones side by side.
Punta Cana Intelligence · Heat Map
Estimated rental yield by sector
Net yield (cap rate) estimates across 12 Punta Cana zones — all figures are estimates.
How to read this data
Every figure on this page is an estimate built from documented sources — published listings, recorded transactions, and short-term-rental performance data — not developer projections. Net yield (cap rate) reflects estimated net operating income against average asking prices per zone; it assumes typical occupancy and operating expenses and is not a guarantee of returns.
Zones marked with CONFOTUR availability contain at least one project classified under Law 158-01, which can affect the 3% property transfer tax and the annual IPI. Classification applies to projects, not zones — always verify the specific resolution before purchasing.
Use these numbers to shortlist, not to decide. Run any specific property through our ROI Calculator and check its incentive status in our CONFOTUR Guide before committing.
Unlock the Full Zone Database
Free users see current estimates. Premium members get the complete picture: verified CONFOTUR project status by zone, remaining exemption years, historical trends, and scenario modeling in the dashboard’s Scenario Lab.
“Premium includes verified CONFOTUR status, remaining exemption years, and the Scenario Lab.”
Zone Intelligence · FAQ
Zone Questions, Answered
The questions investors ask most before choosing where to buy in Punta Cana — answered with the same data behind the dashboard above.
Figures below reflect our data revision of July 1, 2026 · Updated monthly
Which zone in Punta Cana has the highest rental yield? +
Based on our current estimates, Los Corales leads the tracked zones with an estimated net yield of around 7.9%, followed closely by Bávaro, Downtown Punta Cana, and El Cortecito at approximately 7.8%. These zones combine strong short-term-rental demand with entry prices still below the premium tier.
Keep in mind these are zone-level averages, not property-level guarantees. Two units in the same building can perform very differently depending on management, furnishing, and pricing strategy.
What is the cheapest area to buy in Punta Cana? +
Verón currently has the lowest entry ticket among our tracked zones, with units starting around US$70,000 and the lowest average price per m² (~US$1,286). The trade-off: it sits inland, away from the beach corridor, and shows the lowest estimated net yield (~6.0%) of the twelve zones.
A lower entry price is not automatically a better deal — run the actual numbers for any specific unit through our ROI Calculator before deciding.
What is the difference between Bávaro and Cap Cana? +
Bávaro is the volume market: mid-range pricing (~US$1,750/m²), high short-term-rental turnover, and one of the strongest estimated yields (~7.8%). It suits investors optimizing for rental cash flow.
Cap Cana is the premium gated market: the highest price per m² (~US$3,600), a lower estimated yield (~6.8%), but the strongest luxury positioning and the highest average nightly rates (ADR ~US$280). It suits investors prioritizing capital preservation, appreciation, and personal use over cash-on-cash yield.
Neither is "better" — they answer different investment strategies.
Does CONFOTUR apply to an entire zone? +
No. CONFOTUR classification under Law 158-01 is granted to specific projects, not zones. A zone marked "CONFOTUR available" in our dashboard means at least one classified project exists there — it does not mean every property in that zone carries the benefits.
The exemptions (including the 3% property transfer tax and the annual IPI) attach to the project's resolution, with a defined start date and duration. Always verify the specific resolution and its remaining years before purchasing. Our CONFOTUR Guide explains how to do this step by step.
How often is this zone data updated? +
Zone figures are reviewed and refreshed monthly, using documented sources: published listings, recorded transaction data, and short-term-rental performance metrics. The "data as of" date shown in the dashboard reflects the most recent revision.
Premium members additionally get access to historical trends and the verified CONFOTUR project database, including approval year and remaining exemption years per project.
Are these yields guaranteed? +
No — and any platform or seller that guarantees you a yield should raise a red flag. Every figure on this page is an estimate built on documented assumptions about occupancy, nightly rates, and operating expenses. Actual results vary by property, management, and market conditions.
Our role is to give you verified data to shortlist zones and pressure-test what you are being offered — not to promise outcomes. Before committing capital, review our Risk & Due Diligence guide.
All figures are estimates derived from documented sources and dated accordingly; they are not guarantees or investment, legal, or tax advice. CONFOTUR (Law 158-01) classifies projects, not zones. Verify any project's resolution with a qualified professional before investing.
Questions about the data or methodology?
If you still have questions, get in touch — we’re happy to point you to the right resource.