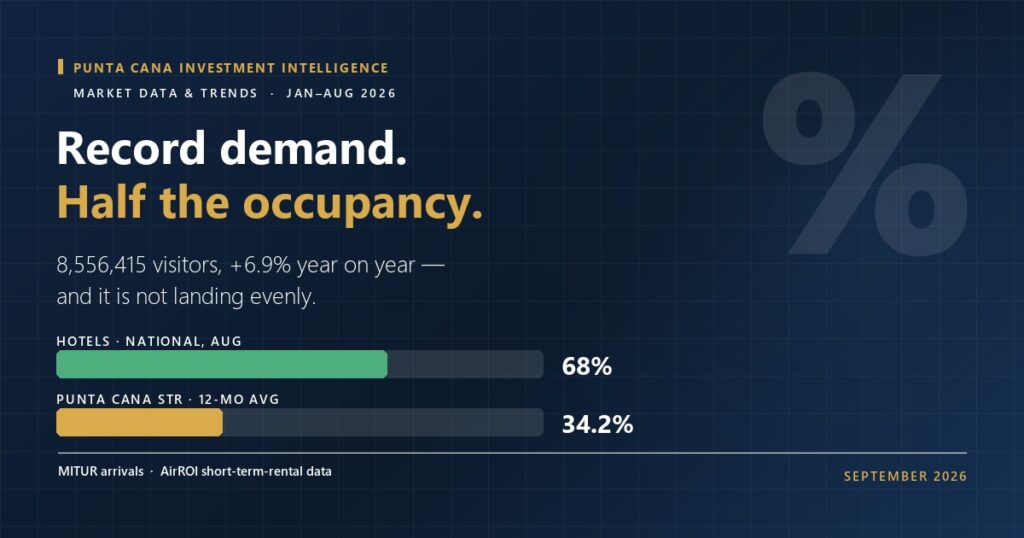
On September 13, 2026, Tourism Minister David Collado announced that the Dominican Republic received 8,556,415 visitors in the first eight months of the year — a record, up 6.9% on 2025, 9.8% on 2024 and 58.9% on 2019. August alone brought 856,858 visitors, and the cruise segment grew 31.9% year on year.
If you own a rental condo in Punta Cana, the natural reaction to a headline like that is to assume your calendar is about to fill. Here is the number that complicates it: over the twelve months to July 2026, the average short-term rental in the Punta Cana market ran at 34.2% occupancy, at a US$155 average daily rate — a RevPAR of about US$52 a night.
Both figures are accurately reported. Understanding why they diverge is, in practice, the difference between a deal that works and a deal that does not.
Dominican Republic, January–August 2026 (MITUR)
August source markets: United States 44%, Canada 9%, Colombia 8%, Argentina 5%, Spain and the UK 4% each, Puerto Rico and Mexico 3% each. Satisfaction scored 4.3 of 5, with 90% saying they would return.
Two occupancy numbers, measuring two different things
The 68% is national hotel occupancy in August. The 34.2% is a trailing-twelve-month average across Punta Cana short-term rental listings. Putting them on the same chart is useful for making a point and misleading if you stop there, so let us be precise about why they differ.
- Different products. The Dominican Republic’s dominant tourism product is the all-inclusive package. That traveller books a resort, not a condo. Roughly two million of this year’s visitors arrived by cruise ship — they book neither.
- Different denominators. A hotel counts rooms it is actively selling. A short-term rental platform counts every listing, including the owner-occupied unit that is only available eight weeks a year and the listing that has not been priced competitively since 2024. Averages across all listings are dragged down by units that are not really trying.
- Different geography. “National hotel occupancy” spans the whole country. Hotel occupancy specifically in the Bávaro–Punta Cana corridor has been measured considerably higher — around 77% in May 2026 — which widens the gap rather than narrowing it.
- Different seasons. March is the peak month for Punta Cana short-term rentals; September is the weakest. Twelve-month averages carry both.
Destination records tell you the market is healthy. They do not tell you what your unit will earn. Only short-term rental data for your zone does that.
The number that actually matters is RevPAR
Nightly rate is the number brokers quote, because it is the flattering one. Revenue per available night — rate multiplied by occupancy — is the one that pays your mortgage.
Same unit, three sets of assumptions
US$155 × 70%$39.6k
US$155 × 52%$29.4k
US$155 × 34.2%$19.3k
Gross annual revenue before operating costs, at a constant US$155 ADR. The spread between the top and bottom line is US$20,300 a year on the same apartment — which is why the occupancy assumption, not the price, usually decides whether a Punta Cana deal works.
One more caution against optimism: AirROI’s own average annual revenue figure for the market — about US$10,793 — sits well below even the bottom line above, because many listings are not live for a full year. If you are buying a unit that will be professionally managed and available year-round, the US$19,000 figure is the fairer floor. If you plan to use it yourself for two months each winter, the lower number is closer to your reality.
Where our zone measurements sit
Our own dataset models a competently run unit in each zone, which is why our zone occupancy assumptions run above the all-listings market average — Cap Cana at 60%, Los Corales at 51%, Bávaro at 47%, Verón at 42%. That is a deliberate choice and you should treat it as one: these are benchmarks for a unit with professional management, competitive pricing and a real photo set, not averages across every listing on the platform.
The practical implication is that the gap between 34.2% and 51% is not a data error. It is the value of management — and it is the part of your return you actually control.
Measured occupancy assumptions by zone — October 2026 cut
(all listings)34.2%
Zone figures are our modelled assumptions for a professionally managed unit; the market average is AirROI’s all-listings measurement for the twelve months to July 2026. See every zone on the zone map.
What to do with this
- Underwrite three cases, not one. Market average, zone benchmark, and your best realistic case. If the deal only clears at the best case, it is not a deal — it is a hope. The ROI calculator takes all three in about two minutes.
- Discount cruise growth to zero. Cruise arrivals grew 31.9% in August and represent almost two million visitors this year. Approximately none of them rent a condo. When a broker cites total arrivals, ask for the air figure.
- Ask for the actual calendar, not the projection. If the seller runs the unit on a platform today, ask for twelve months of booking history. A refusal is an answer.
- Respect seasonality when you sign. March earns; September does not. A closing in Q3 means paying costs for a quarter before the season pays you back — budget the working capital.
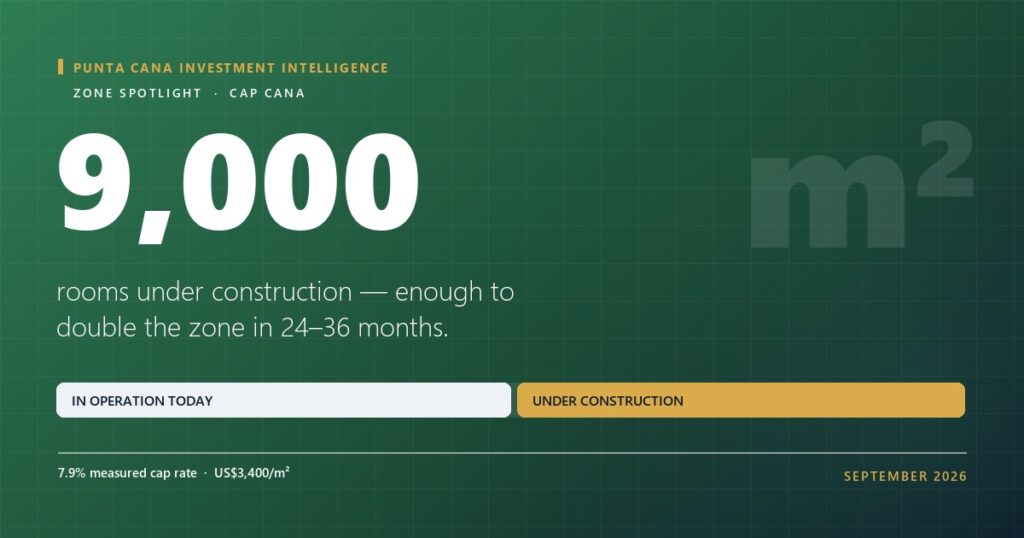
- Watch the supply side as closely as the demand side. Demand is growing at about 7% a year. In Cap Cana alone, roughly 9,000 rooms are under construction. Those two rates are not the same, and the gap lands on occupancy.
There is one plausible force pushing the other way. MITUR’s proposed short-term rental registry would strip unregistered listings off the platforms — thinning exactly the informal, part-time supply that pulls the market average down. It was withdrawn in July and is expected back; the full story is here.
And if you are still choosing a zone rather than a unit, start with the zone map and the Cap Cana vs. Bávaro comparison — the price-versus-yield trade-off has not changed, even as the headline numbers have.
Sources
- Ministerio de Turismo (MITUR) / Dominican Today, “Dominican Republic welcomes record 8.5 million visitors through August 2026”, September 13, 2026 — arrivals, occupancy, satisfaction and source markets.
- Noticias SIN, “RD supera los 8.5 millones de visitantes en los primeros ocho meses de 2026”, September 13, 2026.
- AirROI, Punta Cana short-term rental market report — 34.2% occupancy, US$155 ADR, US$52 RevPAR; data August 2025–July 2026, report updated September 12, 2026.
- SITUR / MITUR hotel occupancy for the Bávaro–Punta Cana corridor, May 2026, as cited in our zone dataset sources.
- Punta Cana Investment Intelligence zone dataset, October 1, 2026 cut.
Data as of September 2026. Zone metrics are market estimates for a professionally managed unit, not appraisals or guarantees; revenue scenarios are illustrative arithmetic. Educational content, not investment advice.