Ask five brokers where to buy and you will hear both of these names in the first minute. They sit on the same coastline, twenty minutes apart, and the received wisdom about them is out of date.
That wisdom goes: Cap Cana is where you park capital and accept a weak yield; Bávaro is where you chase cash flow. As of October 2026, our dataset says the yield ranking has flipped — Cap Cana measures 7.9% against Bávaro’s 7.1%. The real trade-off is no longer yield. It is how much capital you have to put at risk to get it.
Head to head — October 2026
Average unit price: US$442,000 in Cap Cana against US$151,000 in Bávaro. That ratio, not the cap rate, is the decision.
Cap Cana: the rate carries the price
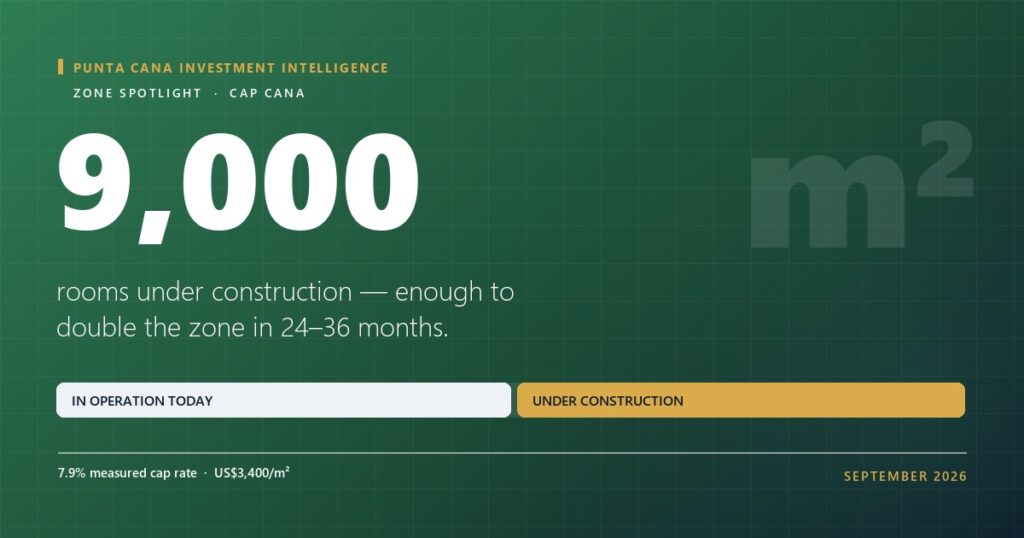
At US$3,400/m², Cap Cana is the most expensive zone we track. Typical tickets run US$250,000 to US$1,300,000. What has changed is the income side: a US$320 average daily rate at roughly 60% occupancy is enough to carry that price, even after luxury-grade operating costs of about 50% of gross. The result is a measured 7.9% cap rate — the strongest of the 12 zones.
Bávaro: the ticket carries the risk
Bávaro is the tourist core: US$1,888/m², tickets mostly US$100,000–US$195,000, and a measured cap rate of 7.1%. Occupancy runs near 47% and the ADR (US$114) is a fraction of Cap Cana’s — but so is the entry price, and the renter pool is the deepest in the region. Bávaro’s case was never the highest yield. It is that you can be wrong here for US$151,000 instead of US$442,000.
The honest comparison
- Same budget, different shape. One Cap Cana unit, or roughly three Bávaro units spread across different buildings. Concentration versus diversification is the actual question on the table.
- Yield. Cap Cana currently leads. Note what that depends on: 60% occupancy at a US$320 rate. If either softens, the ranking flips back — and roughly 9,000 rooms are under construction inside the gate.
- Appreciation. Both sit in the same band as the rest of the coast; the leaders are Cap Cana and Macao at 8%/yr.
- Liquidity. Bávaro’s market is messier and far more liquid. Cap Cana resale is thinner, and thin markets are slow in exactly the moments you want to be fast.
- Risk profile. Cap Cana concentrates operator, HOA and supply risk in one premium ecosystem. Bávaro spreads it across a fragmented, competitive one.
Run both scenarios yourself in the ROI calculator, and see where every other zone lands on the zone map. For the full picture across all 12 zones, start with the price map.
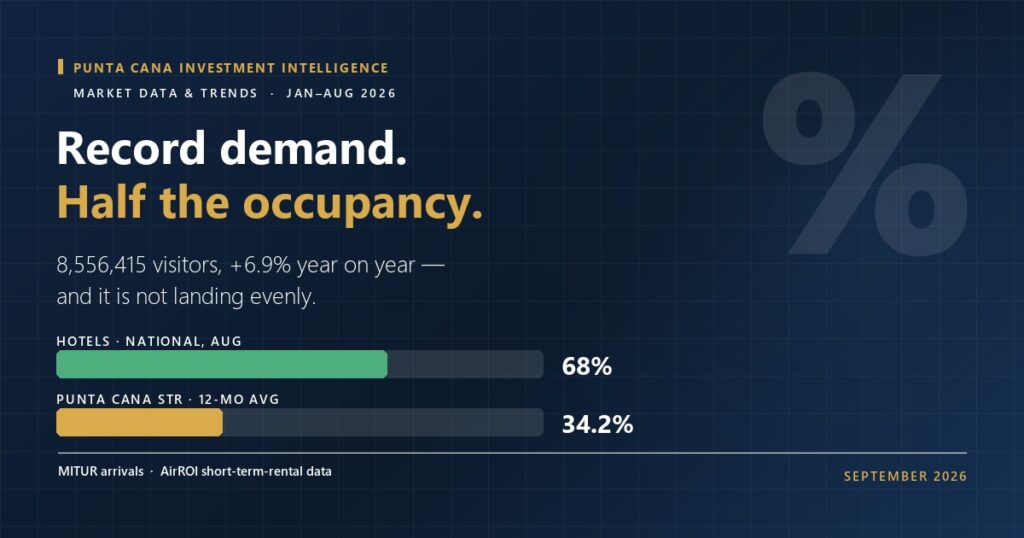
Two cautions before you act on either. First, those occupancy assumptions describe a professionally managed unit — the market-wide average is roughly half of them. Second, if the specific building is CONFOTUR-classified, the tax math changes materially: here is what Law 158-01 actually waives.
Data as of October 1, 2026 — market estimates for a professionally managed unit, not appraisals. Educational content, not investment advice.