Every cut we re-query prices, rental yields and occupancy for the 12 zones we track around Punta Cana. The October 2026 refresh puts the spread at US$1,400/m² (Verón) to US$3,400/m² (Cap Cana) — a 2.4x difference within a 40-minute drive. That spread, not the average, is the number that should shape your search.
Price per m² by zone — October 2026
Market estimates for a typical residential unit, built from documented official and secondary sources. Every zone carries its own “as of” date in the dashboard.
What the data says
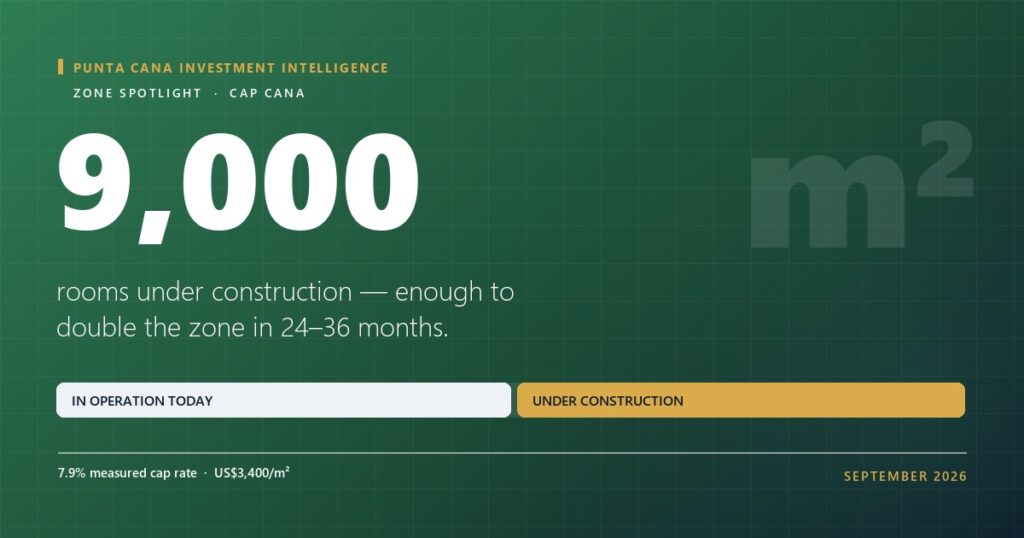
- Top of the market: Cap Cana at US$3,400/m², with typical tickets from US$250,000 to US$1,300,000. You are paying for golf, marina and gate.
- Best measured cap rate: Cap Cana at 7.9% — followed by Bávaro at 7.1% and Downtown Punta Cana at 7.1%.
- Weakest measured cap rate: Punta Cana Village at 5.1%, where the price has run ahead of what the unit earns.
- Fastest appreciation: Cap Cana and Macao, around 8%/yr.
- Value end: Verón at US$1,400/m² is the inland entry ticket; you trade beach proximity for price.
Cheap does not mean high-yielding
This is the part most buyers get backwards. The intuition is that the cheapest zone must throw off the best yield, because you are paying less for the same rent. The data says otherwise: yield tracks what the unit earns per night and how often it is full, and both of those move with the quality of the location rather than against its price.
Measured cap rate by zone — October 2026
Cap rate is derived, not quoted: gross = ADR × 365 × occupancy, net income = gross × (1 − operating expense ratio), cap rate = net income ÷ average unit price. Change any input in the ROI calculator and watch it move.
Read the two charts together and the shape of the market appears. Price per m² and cap rate are not mirror images. The most expensive zone can also be the best-yielding one when its nightly rate is high enough to carry the price, and a mid-priced zone can yield poorly when its rate has not kept up with what sellers are asking.
In Punta Cana you are buying three separate things — price, yield and appreciation. Check all three per zone before you decide which one matters most to you.
How to use this
Start with the interactive zone map to see all 12 zones side by side, then stress-test any zone that catches your eye in the ROI calculator with your own numbers — price, ADR, occupancy and holding costs.
If you are torn between the luxury end and the value end, our spotlight Cap Cana vs. Bávaro walks through exactly that trade-off with the current figures. And before you read any zone’s occupancy assumption as a promise, see why the market-wide average is far lower.
Data as of October 1, 2026. Zone metrics are market estimates built from documented official and secondary sources, not appraisals; every figure carries its “as of” date in the dashboard. This is educational content, not investment advice.