
Skip to content
  • ZonesMap & prices
  • CONFOTURProject directory
  • CalculatorsROI & risk
  • GuidesTaxes & due diligence
  • BriefingResearch & analysis
  • Already a member? Log in
  • Go Premium
  • ZonesMap & prices
  • CONFOTURProject directory
  • CalculatorsROI & risk
  • GuidesTaxes & due diligence
  • BriefingResearch & analysis
  • Already a member? Log in
  • Go Premium
ESEN

Category: Market Data & Trends

Zone prices, rental yields and what is actually moving in the Punta Cana market — dated and sourced.

8.5 Million Visitors, 34% Occupancy: The Gap That Decides Your Punta Cana Return
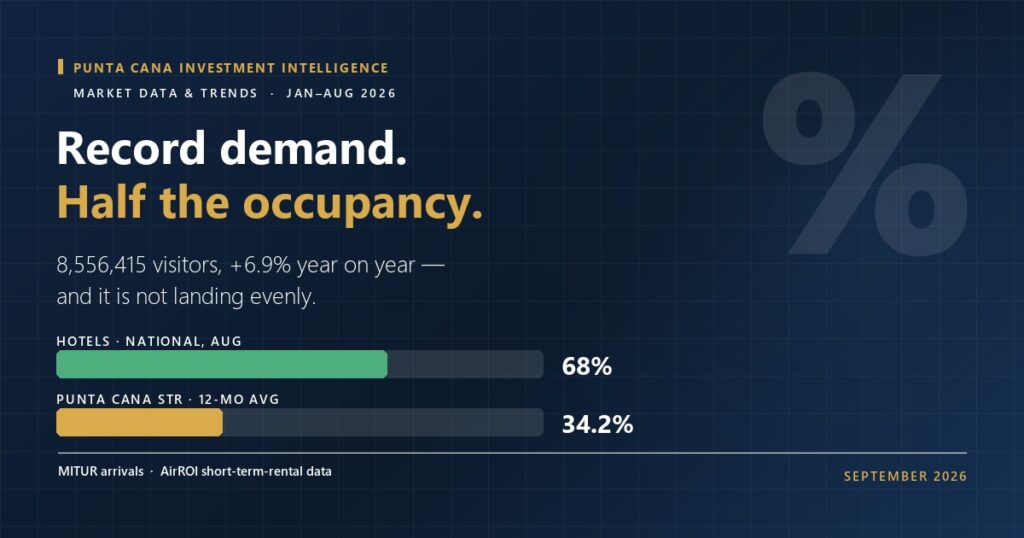
Record demand, half the occupancy: national hotel occupancy 68% versus Punta Cana short-term rental occupancy 34.2%

The Dominican Republic just posted its best eight months on record. National hotel occupancy ran 68% in August; the average Punta Cana short-term rental ran 34.2% over the last twelve months. Both numbers are real — and the distance between them is the whole investment case.

The Punta Cana Price Map: US$1,400–3,400/m² Across 12 Zones

Our October 2026 refresh puts the cheapest tracked zone at US$1,400/m² and the most expensive at US$3,400/m² — a 2.4x spread on the same coast. The surprise is which end of it actually yields more.

Facebook X-twitter Instagram

© 2026 Punta Cana Investment Intelligence. All rights reserved. · Research · Terms of Service · Refund Policy